
In my previous post I showed you how to collect and parse the FSLogix event log with Log Analytics. In this post I will show you how to use that event log to calculate WVD profile load time. Calculating logon time is one of those things that can provide value into our users experience. And if you have a baseline you can determine if there are issues, sometimes before the user lets you know.
Logon Times and Tools
First there are some logon times already available. First, with WVD 2.0 comes with diagnostic logs that are easier to enable and collect. There is a query provided for Average Session Logon time by hostpool. Its provided in the example queries when you first open up your Log Analytics workspace. There are a number of other examples filtered by resource type.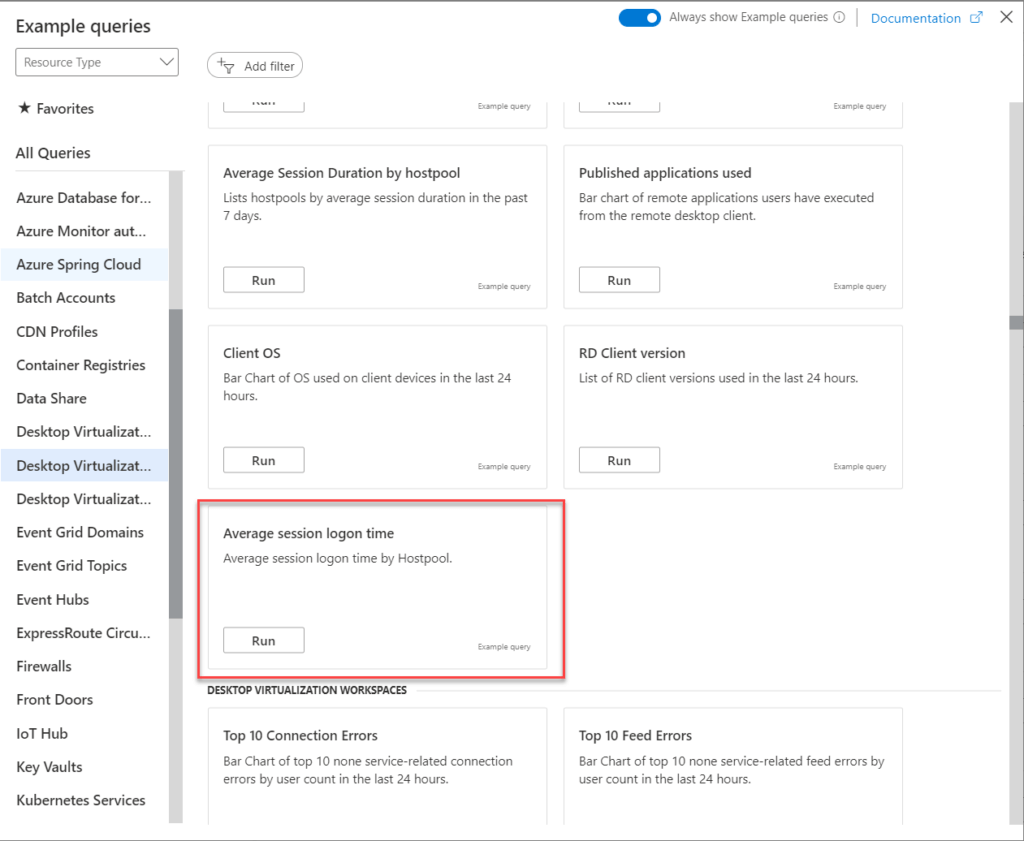
and here is the query.
// Average session logon time
// Average session logon time by Hostpool.
// Lists average session logon time by hostpool
WVDConnections
| where TimeGenerated > ago(24h)
| where State == "Started"
| project CorrelationId , UserName, ConnectionType , StartTime=TimeGenerated, _ResourceId
| join (WVDConnections
| where State == "Connected"
| project EndTime=TimeGenerated, CorrelationId)
on CorrelationId
| project Duration = EndTime - StartTime, _ResourceId
| summarize AvgDuration=avg(Duration) by _ResourceId
| extend Multi=split(_ResourceId, "/")
| project AvgDuration, ResourceGroup=Multi[4], HostPool=Multi[8]
| sort by AvgDuration desc
You can easily modify this query to do it by user, or session host as well.
As mentioned, however, this only works if you are using WVD 2.0 diagnostic logs. WVD 1.0 may have diagnostic logs, I’m not sure, at best they are difficult to enable, at worst its not possible. Also I do not know what they are considering connected. Is it desktop rendered? Profile loaded?
If you are using Intune, under Reports, Endpoint Analytics you have Startup Performance. 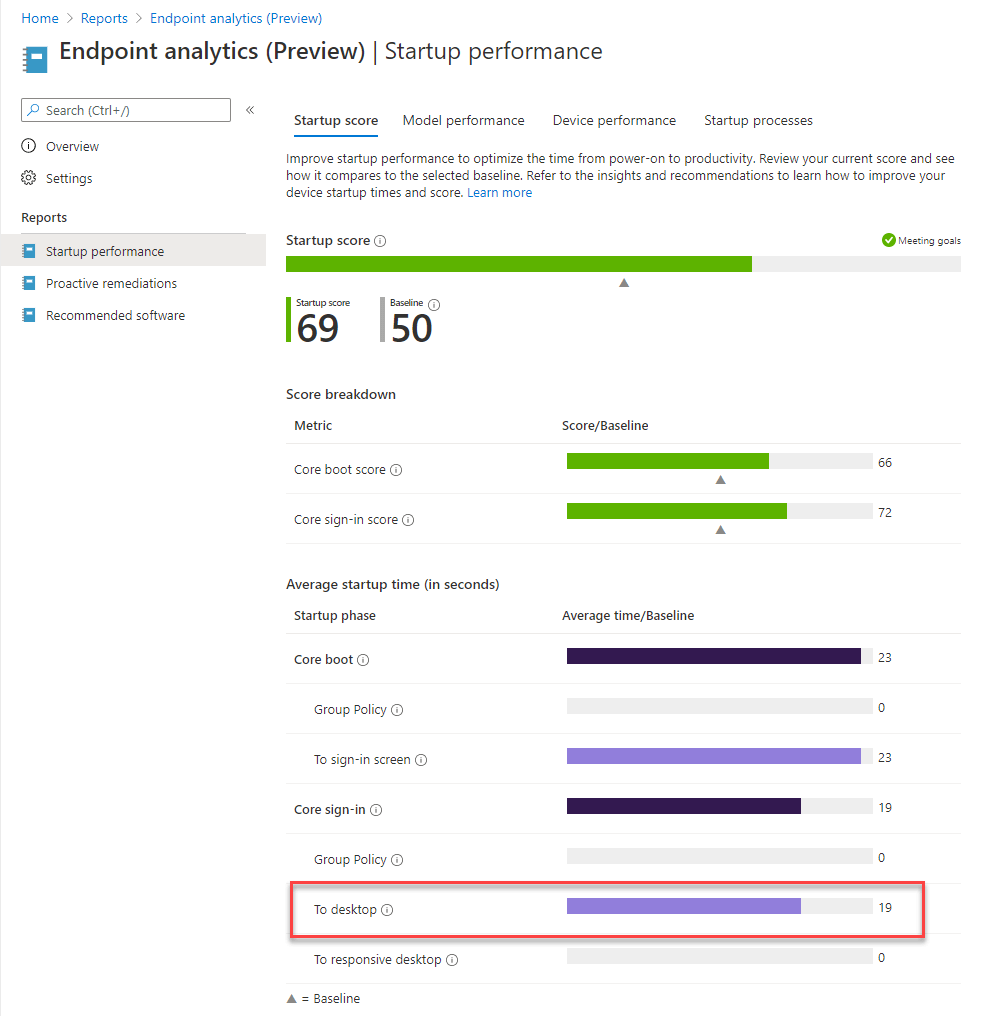
These are also useful, but only if you are using Intune to help manage your WVD Windows 10 environment.
Calculate WVD Profile Load Time
To calculate profile load time, we need two event logs. The FSLogix event log I showed you how to collect in my previous post. And the Security event log. I have not confirmed but I believe the only way to collect it is by enabling Azure Security Center.
First we’ll grab our Security logs.
SecurityEvent
| where EventID == 4624
| where AccountType == "User"
| where LogonType == 3
| project UserName = TargetAccount, Computer, LogonTime=TimeGenerated, TimeCollected
| extend UserName = replace(@"CORP.DOMAIN.COM\\", @"", UserName)
| extend UserName = replace(@"CORP\\", @"", UserName)
This code grabs successful network logons by users, then I project TargetAccount, Computer, TimeGenerated and TimeCollected, while renaming a few fields.
the other side of my query is the FSLogix Log from my collection post.
Event
| where Source == 'FSLogix-Apps'
| where EventID == 25
| parse RenderedDescription with * "Username: " UserName:string " "*
| project UserName, Computer, LoadTime=TimeGenerated
I grab the EventID 25 which is successful profile load, then parse the RenderedDescription for UserName, and project UserName, Computer, and TimeGenerated.
I join the two queries on UsuerName and Computer.
SecurityEvent
| where EventID == 4624
| where AccountType == "User"
| where LogonType == 3
| project UserName = TargetAccount, Computer, LogonTime=TimeGenerated, TimeCollected
| extend UserName = replace(@"CORP.DOMAIN.COM\\", @"", UserName)
| extend UserName = replace(@"CORP\\", @"", UserName)
| join(Event
| where Source == 'FSLogix-Apps'
| where EventID == 25
| parse RenderedDescription with * "Username: " UserName:string " "*
| project UserName, Computer, LoadTime=TimeGenerated) on UserName, Computer
Finally, we start on the math portion.
| extend ProfileLoad = datetime_diff('second',LoadTime,LogonTime)
| where ProfileLoad > 0
| where ProfileLoad < 1800
First, I use datetime_diff so that I can declare the unit of measure I want back. You certainly can use Time1 – Time2 as in the above WVD logon session query provided by the Log Analytics examples. Secondly, I use ProfileLoad where above 0, I was getting some anomalies like negative profile load times, I suspect from there being way more security logs than profile load logs. Given that profile loads can’t be negative I throw that data out. I also throw out anything above 30 minutes, which is 1800 seconds. If you have an actual profile load time of 30 minutes or more, your helpdesk is going to hear about it long before that log comes in for calculation.
Lastly, we can use summarize, to get min, max and average for Hostpool, sessionhost or users.
summarize by user:
SecurityEvent
| where EventID == 4624
| where AccountType == "User"
| where LogonType == 3
| project UserName = TargetAccount, Computer, LogonTime=TimeGenerated, TimeCollected
| extend UserName = replace(@"CORP.DOMAIN.COM\\", @"", UserName)
| extend UserName = replace(@"CORP\\", @"", UserName)
| join(Event
| where Source == 'FSLogix-Apps'
| where EventID == 25
| parse RenderedDescription with * "Username: " UserName:string " "*
| project UserName, Computer, LoadTime=TimeGenerated) on UserName, Computer
| extend ProfileLoad = datetime_diff('second',LoadTime,LogonTime)
| where ProfileLoad > 0
| where ProfileLoad < 1800
| summarize avg(ProfileLoad), min(ProfileLoad), max(ProfileLoad) by UserName
SecurityEvent
| where EventID == 4624
| where AccountType == "User"
| where LogonType == 3
| project UserName = TargetAccount, Computer, LogonTime=TimeGenerated, TimeCollected
| extend UserName = replace(@"CORP.DOMAIN.COM\\", @"", UserName)
| extend UserName = replace(@"CORP\\", @"", UserName)
| join(Event
| where Source == 'FSLogix-Apps'
| where EventID == 25
| parse RenderedDescription with * "Username: " UserName:string " "*
| project UserName, Computer, LoadTime=TimeGenerated) on UserName, Computer
| extend ProfileLoad = datetime_diff('second',LoadTime,LogonTime)
| where ProfileLoad > 0
| where ProfileLoad < 1800
| summarize avg(ProfileLoad), min(ProfileLoad), max(ProfileLoad) by Computer
SecurityEvent
| where EventID == 4624
| where AccountType == "User"
| where LogonType == 3
| project UserName = TargetAccount, Computer, LogonTime=TimeGenerated, TimeCollected
| extend UserName = replace(@"CORP.DOMAIN.COM\\", @"", UserName)
| extend UserName = replace(@"CORP\\", @"", UserName)
| join(Event
| where Source == 'FSLogix-Apps'
| where EventID == 25
| parse RenderedDescription with * "Username: " UserName:string " "*
| project UserName, Computer, LoadTime=TimeGenerated) on UserName, Computer
| extend ProfileLoad = datetime_diff('second',LoadTime,LogonTime)
| where ProfileLoad > 0
| where ProfileLoad < 1800
| where Computer has "prd-eus-poolprefix"
| summarize avg(ProfileLoad), min(ProfileLoad), max(ProfileLoad)