In this post I will expand upon the methods I showed here and show you how I do IaaS Alerting in Azure Monitor. As a refresher I believe alerting at scale is:
- Programmatic Alert Creation
- Automatically adds/removes resources
Having read my previous posts you’ll also know that I prefer a Log Analytics workspace for Metric alerts. I prefer this for a few reasons, which I’ll go into below.
PowerShell Modules and Commands
To create our alerts we’ll need the following modules:
- Az.Monitor
- Az.OperationalInsights
We’ll also need the following commands:
-
Get-AzOperationalInsightsWorkspace
-
New-AzOperationalInsightsWorkspace
- New-AzOperationalInsightsLinuxPerformanceObjectDataSource
-
Enable-AzOperationalInsightsLinuxPerformanceCollection
-
New-AzOperationalInsightsWindowsPerformanceCounterDataSource
-
Get-AzActionGroup
-
New-AzActionGroup
-
New-AzMetricAlertRuleV2DimensionSelection
-
New-AzMetricAlertRuleV2Criteria
-
Add-AzMetricAlertRuleV2
Deploy Log Analytics Workspace
Since I did not cover it in my previous post, I’ll share a snippet here. I’ve mentioned this before in other posts, but my preferred method for alerting for VMs is with Log Analytics. First, it allows you to set alerts all VMs reporting to that workspace. Any new machines that get added to the workspace are subject to alerting. Conversely if you decommission a VM the alert isn’t tied to that particular resource. Secondly, to get metrics other than CPU and Disk, you have to use a Log Analytics workspace.
#get log analytics workspace, if it doesnt exist, create it.
$workspaceObject = Get-AzOperationalInsightsWorkspace -ResourceGroupName $rgobject.ResourceGroupName -Name $workspace -erroraction SilentlyContinue
if($workspaceObject){
Write-Host "Workspace '$workspace' already exists" -ForegroundColor Yellow
}else{
Write-Host "Creating '$workspace'" -ForegroundColor Yellow
$workspaceObject = New-AzOperationalInsightsWorkspace -Location $location -Name $Workspace -Sku Standard -ResourceGroupName $RGObject.ResourceGroupName
Write-Host "successfully created Workspace '$workspace'" -ForegroundColor Green

}
This code will check for the workspace in the resource group you specify. If it exists it moves on, if it doesn’t it will create it and put the returned Azure object in $workspaceObject. Because we’ll need it later to create our alerts.
Windows vs Linux Metrics
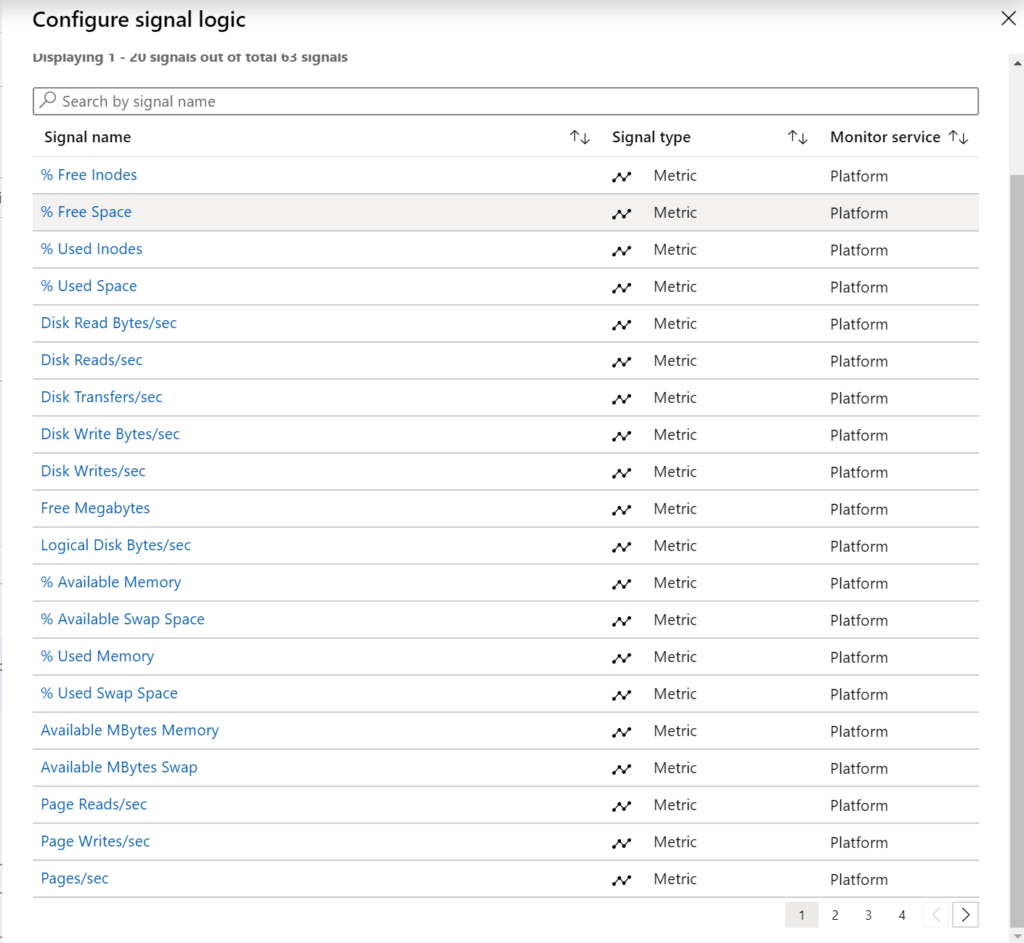
When creating your metric alerts, you’ll need to know the object name and counter name. Unfortunately at this time, the only way to tell Linux and Windows counters apart is through a query. Even using Get-AzMetricDefinition against the workspace doesn’t differentiate between the two OS’es. The signal logic in the portal isn’t any help either.
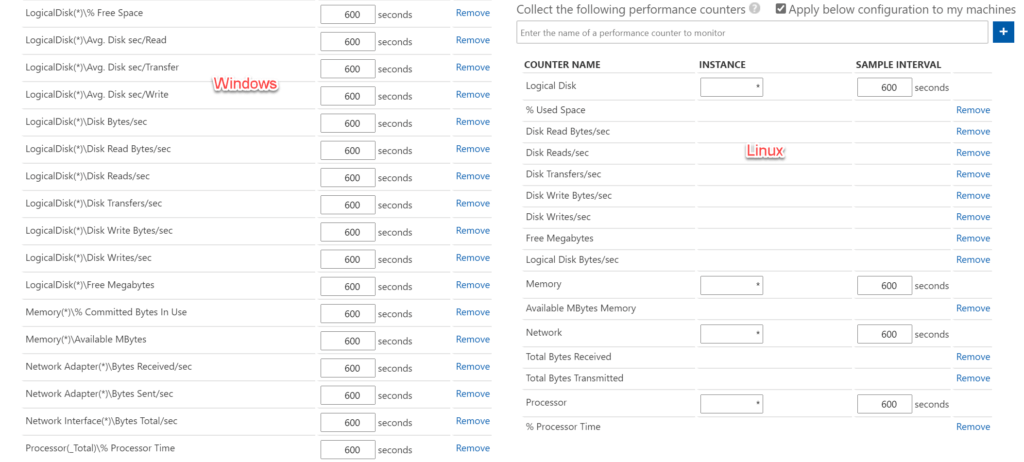
This is the advanced view where you would add the counters via the portal for Windows and Linux.
Using this query, with the inventory properties from the heartbeat table, and sorting by Countername you can see which counters are available for both Windows and Linux and which aren’t.
Heartbeat
| distinct Computer, OSType
| join (
Perf
| distinct CounterName, ObjectName, Computer) on Computer
| distinct OSType, ObjectName CounterName
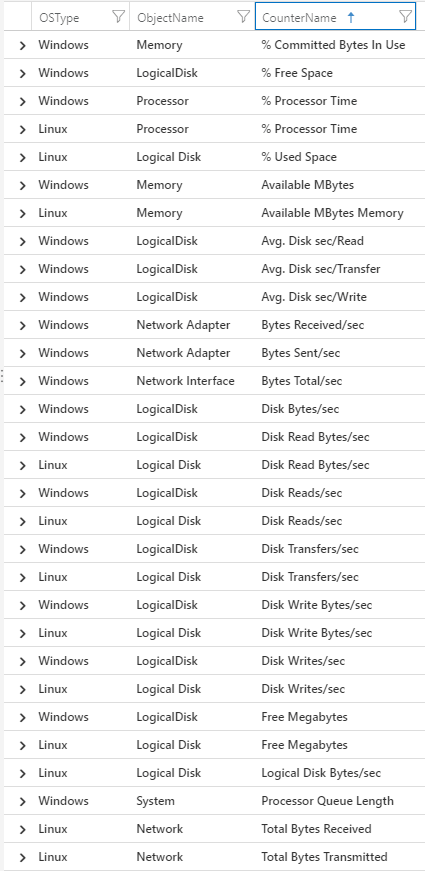
Note that while many of the logical disk counter names are the same, the object name for windows is “LogicalDisk,” but with Linux its “Logical Disk.”
Deploying Counters to Workspace
Now that we know the differences between the Linux and Windwos counters we need to add them to our workspace.
New-AzOperationalInsightsLinuxPerformanceObjectDataSource -ResourceGroupName $RGObject.ResourceGroupName `
    -WorkspaceName $WorkspaceObject.Name `
    -ObjectName "Logical Disk" `
    -InstanceName "*"  `
    -CounterNames @("% Used Space") `
    -IntervalSeconds $perfInterval  `
    -Name "Linux Disk Performance Counters - Used Space"
Enable-AzOperationalInsightsLinuxPerformanceCollection -ResourceGroupName $RGObject.ResourceGroupName -WorkspaceName $workspaceObject.Name
Using New-AzOperationalInsightsLinuxPerformanceObjectDataSource we can add any counters we want. We then need to follow that up with Enable-AzOperationalInsightsLinuxPerformanceCollection otherwise the collection doesn’t get enabled.
For Windows we’ll use New-AzOperationalInsightsWindowsPerformanceCounterDataSource. (man these commands are a mouthful)
New-AzOperationalInsightsWindowsPerformanceCounterDataSource -ResourceGroupName $RGObject.ResourceGroupName `
-WorkspaceName $workspaceObject.Name `
-ObjectName "Memory" `
-InstanceName "*" `
-CounterName "% Committed Bytes In Use" `
-IntervalSeconds $perfInterval `
-Name "Windows Memory Performance Counter - Percent Committed Bytes In Use"
For whatever reason we don’t have to run a second command to enabled the Windows counters, simply running the command adds them. Also note while I’m using separate variables for RGObject and WorkspaceObject, the alerts need to go into the same resource group as the Log Analytics workspace.
Creating IaaS Alerts
Borrowing more code from my previous PowerShell alerting post. This next code assumes the action group has already been created and all we need to do is grab it. We’ll then create an alert for each of the metrics we added above.
$act = Get-AzActionGroup -ResourceGroupName VS_Monitoring -Name email
$action = New-AzActionGroup -ActionGroupId $act.id

$dim = New-AzMetricAlertRuleV2DimensionSelection -DimensionName "Computer" -ValuesToInclude "*"</pre>
#set alert criteria and counter Linux - % Used Space
$criteria = New-AzMetricAlertRuleV2Criteria -MetricName "Average_% Used Space" `
-DimensionSelection $dim `
-TimeAggregation $aggregation `
-Operator $diskOperator `
-Threshold $DiskThreshold

Add-AzMetricAlertRuleV2 -Name "Linux Disk Space Alert" `
-ResourceGroupName $RGObject.ResourceGroupName `
-WindowSize 00:05:00 `
-Frequency 00:01:00 `
-TargetResourceId $workspaceObject.ResourceId `
-Condition $criteria `
-ActionGroup $action `
-Severity $severity

#set alert criteria and counter Windows % Committed Bytes In Use
$criteria = New-AzMetricAlertRuleV2Criteria -MetricName "Average_% Committed Bytes In Use" `
-DimensionSelection $dim `
-TimeAggregation $aggregation `
-Operator $memoryOperator `
-Threshold $MemThreshold

Add-AzMetricAlertRuleV2 -Name "Windows Memory Usage Alert" `
-ResourceGroupName $RGObject.ResourceGroupName `
-WindowSize 00:05:00 `
-Frequency 00:01:00 `
-TargetResourceId $workspaceObject.ResourceId `
-Condition $criteria `
-ActionGroup $action `
-Severity $severity
You’ll want to pay attention to the operator that you use for each alert. For disk depending on the counter you’ll want to use less than or equal to. Whereas for most other counters you’ll want to use greater than or equal to.
Resource Group and Resource Specific Alerting
If for some reason you’re not using or unable to use a Log Analytics worksapce, you can setup alerts from the host metrics via Resource Group or specifically on a VM. You would change the ResourceID to the Resource Group or VM you want to set the alerts again.
I would be remiss to not mention networking. IaaS is not just VMs, it still involves networking. Unfortunately at this time, you can’t set them against a Resource Group or Log Analytics. You have to set them against the specific networking resource. This makes automating alerts much more tedious.
Azure Monitor IaaS Alerting Summary
This is a basic setup just for IaaS VMs. From here if you needed to set this up for multiple environments you could feed all of this information in via a spreadsheet and have Powershel loop through creating the counters on the workspace and then creating the alerts.