
The Azure Advent Calendar is a great idea from Gregor Suttie and Richard Hooper. Community members the world over have contributed videos pertaining to Azure. My video is on Azure Monitor Workbooks. In the video I take you through many of the useful features of Workbooks.
Video Outline
Below is the rough video outline with comments and or links that I didnt provide in the video.
- Brief Overview of Azure Monitor
- Dash boarding in Azure
- View Designer – Limited to only Log Analytics, and a single subscription. Likely to be phased out, do not recommend using
- Azure Dashboards – Great option for static dashboards across subscriptions, Log Analytics, App Insights and Azure Resource Grpah, recently added auto refresh
- Workbooks
- Third Party Solutions
- Grafana
- SquaredUp
- Best Practices
- Minimize Workspaces
- Optimize Queries
- Don’t over complicate workbooks
- Workbooks Everywhere – Presently you can find workbooks under the Azure Monitor Workbooks tab. Under Log Analytics workspaces where some workbooks have been provided if you’ve installed that solution. Application Insights workbooks tab. There are even some hiding in the VM Insights solution tab. It would be great if all available workbooks were brought under the Azure Monitor workbooks tab.
- Understanding and Building Workbooks
- Workbook Parameters – if you watch nothing else, watch this section to get an idea of how to start using Parameters in your workbooks. They’re pretty much the key to any of the MS provided workbooks. Link to the Update Management workbook shown.
- Metric Workbooks – I take a look at the really good Storage Accounts workbook to examine how it was contructed.
- Azure Health & Azure Monitor Alerts
- Azure Resource Graph – Creating an Azure Resource Graph Workbook.
Youtube Video
and embedded.
Cut for Time
-
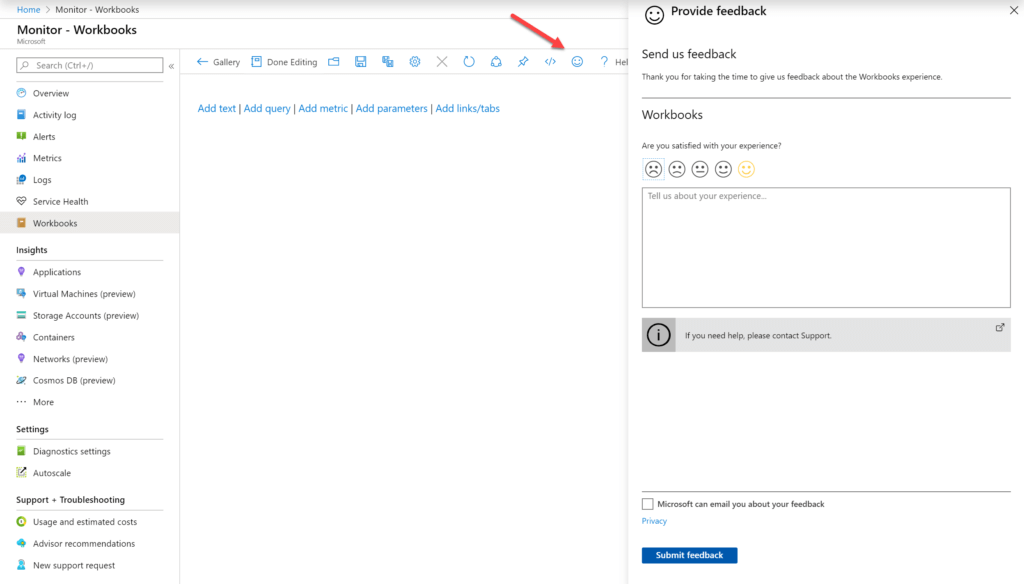
- Feedback – I have used the feedback feature within Azure Monitor Workbooks several times, and almost every time I’ve gotten a response within a few hours. The team and everyone I’ve talked to has been extremely helpful and they *want* your feedback. When I asked a member of the team what I should include in the video I got this response:
Send feedback! We try to respond to every feedback we get (as you see here!) so if people have comments/questions, feedback is good, try to be explicit about what you’re doing or what you want, and if you don’t want to do it via feedback, the github repo (there’s a link in the info box at the bottom of the gallery by the owl) is another place to get docs, details, examples and post issues.
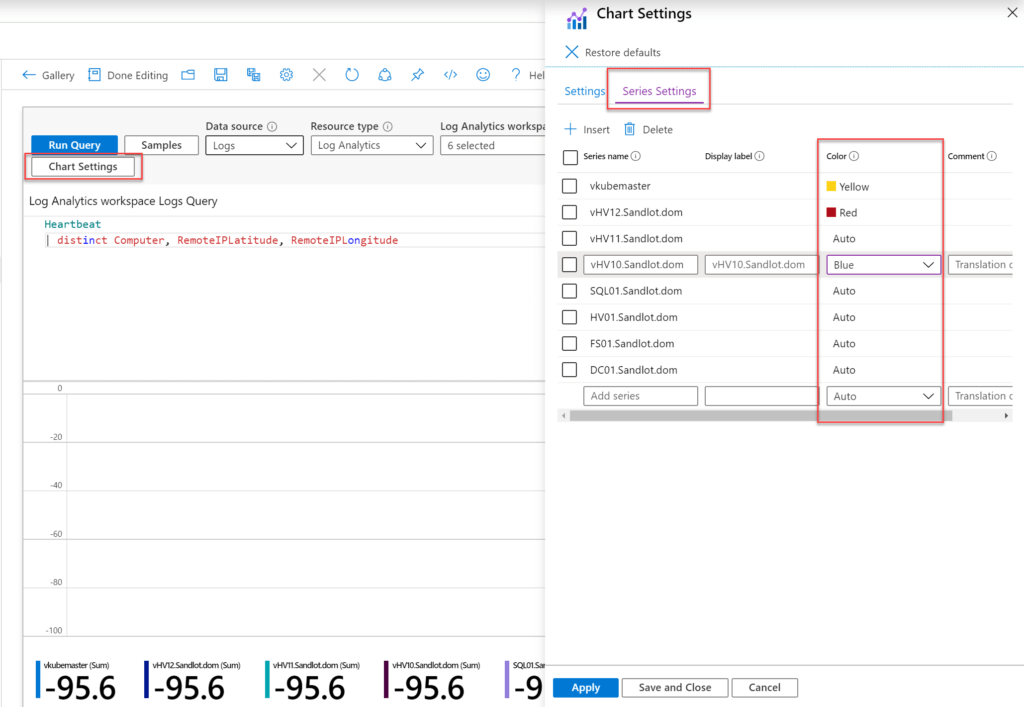
- Chart/Widget Color Schemes – I mentioned this in my blogpost about the Update Management workbook, at the time you could not set the color scheme of Pie Charts. You can now set the color scheme for all of the available widgets. Im currently working on updating my Update Management workbook and will push it to my github when ready.
Select Chart Settings -> Series Settings -> Color.
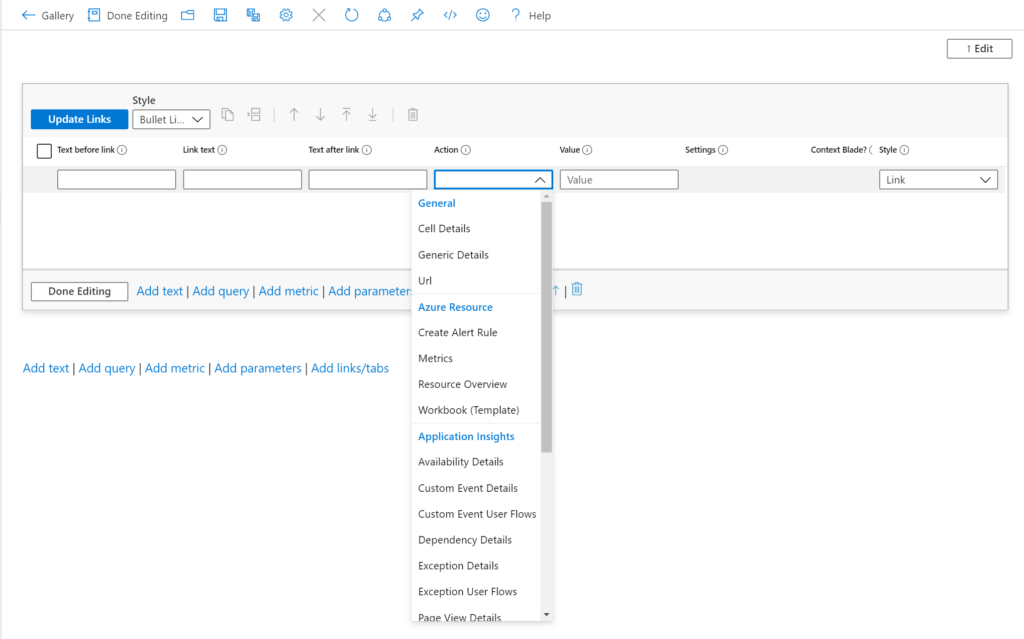
- Links – Any resource where you see the normal blue underline text will take you to that Azure Resource within the portal. But you can also add specific links. Directly to Application Insights, or a specific URL.
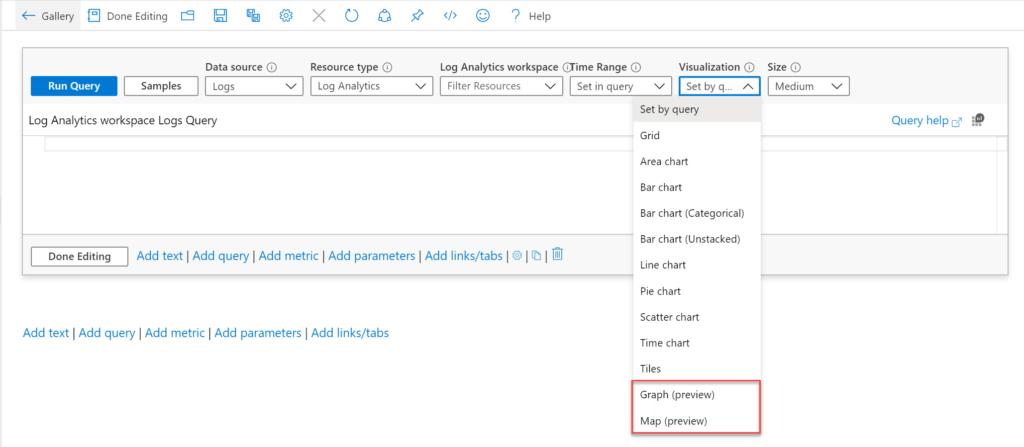
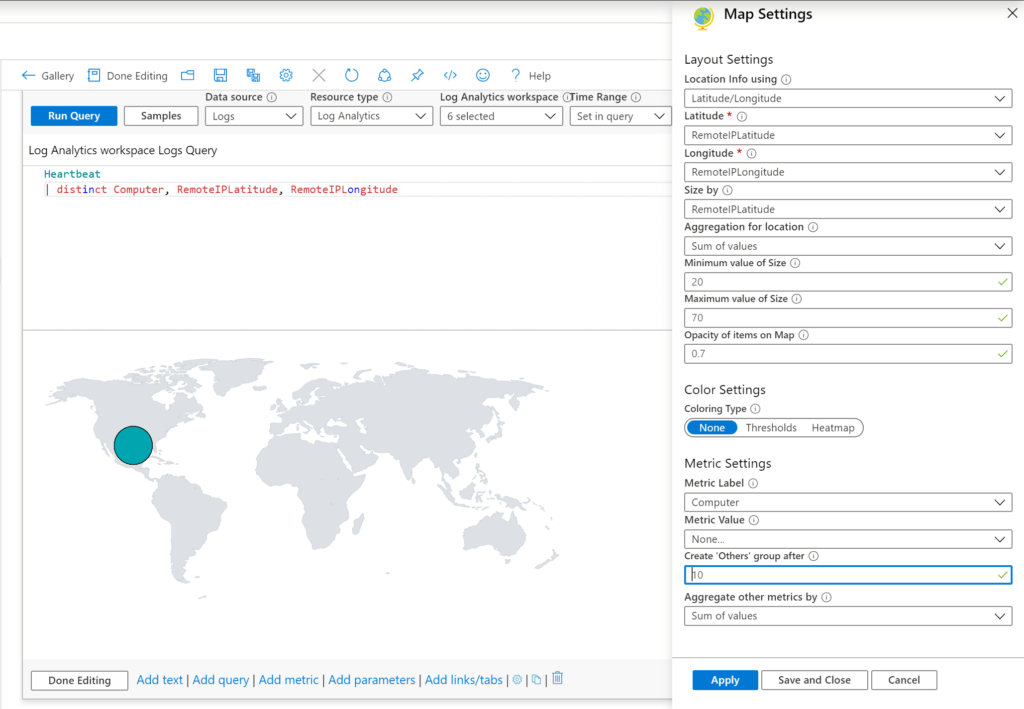
- Graph and Map – Graph and Map are both in preview, but as you can see below with a Lat and Long in your data you can plot against the map.
- Feedback – I have used the feedback feature within Azure Monitor Workbooks several times, and almost every time I’ve gotten a response within a few hours. The team and everyone I’ve talked to has been extremely helpful and they *want* your feedback. When I asked a member of the team what I should include in the video I got this response:
I hope by the end of this post and video you understand why I think Azure Monitor Workbooks are extremely useful and flexible and why they are my favorite way to perform visualizations within Azure.