This post assumes you have some basic knowledge of Azure Monitor. If you are not familiar with Alerts in Azure Monitor you can read more about them here. This post might be a little different from my other posts in that I’ll be covering several topics under Alerting.
Log Search vs Metric Alert
Within Azure Monitor we have several types of Alerts, the two this post talks about the two most base level which are Log Search Alerts and Metric alerts. Metric alerts can be created without a Log Analytics workspace, Log Search, requires one. That said there are *some* metric alerts that cannot be created without a Log Analytics workspace. For instance, to alert on RAM for a VM this requires a Log Analytics workspace and to collect the Perf counters in that workspace.
Metric Alerts are also faster.
take this query for example
Perf | where CounterName == "% Committed Bytes In Use" and CounterValue > 90
while this will perform the exact same action as a metric alert for % Committed Bytes In Use above 90% its considered a log search and thus slightly slower than setting up the alert as a Metric alert.
Use Dimensions for Metrics
When setting up a metric alert, in this case for VMs, check the Computer dimension, otherwise it is an aggregate of all machines submitting that specific counter. 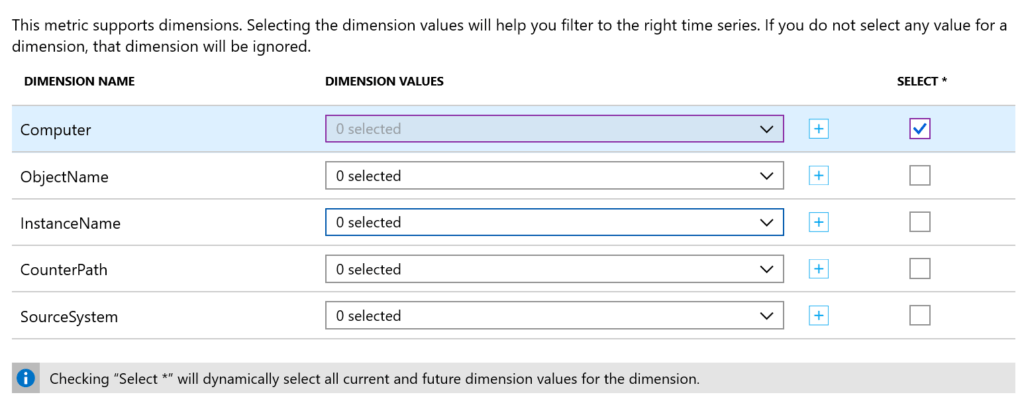
You can select only specific machines you want to alert on. You can also select * which will cover all current and new machines reporting to that workspace.
There are a number of dimensions for other types of metrics as well, be sure to carefully look at what you want to alert on.
Finally, be sure to check you have the correct metric you want to alert on. Take this screen grab. 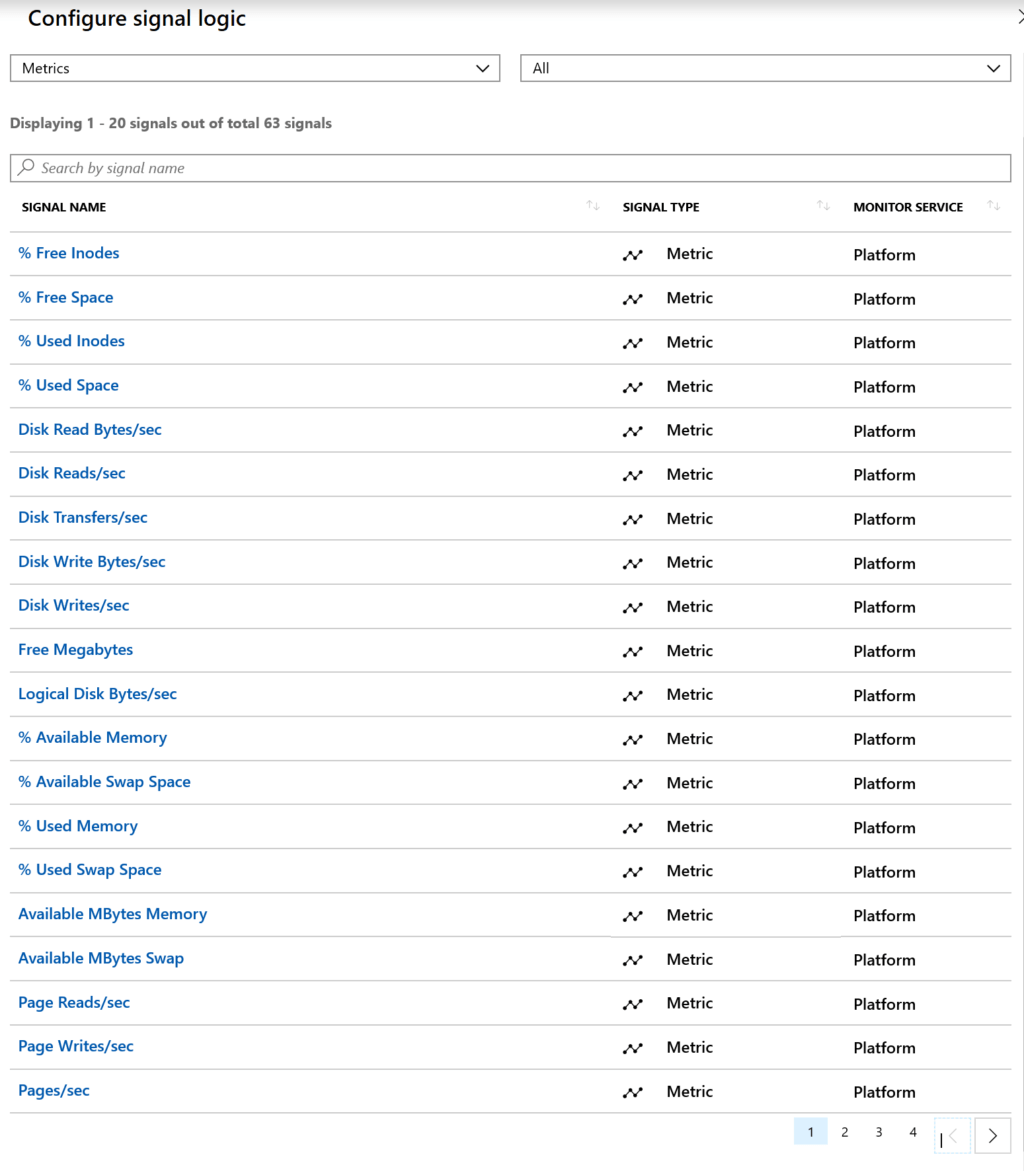
Some of these Metrics are for Windows and some are for Linux. For example, % Available Memory is not available under Windows Counters. It would be nice if they added a field here that showed what it belongs to. That said, fellow MVP Adin Ermie put together an exhaustive list of the Azure Metrics you can find here.
Use Project on Log Search Alerts
When using Log Search alerts, I highly recommend you use Project to only send the fields you need in your alert. This will help in your email based alerts, but also in your automated remediation action groups that can trigger LopicApps, Azure Functions and Azure Automation Runbooks.
Take this query to detect print spooler service stopped
ConfigurationData
| where SvcName == "Spooler" and SvcState == "Stopped"
| project Computer, SvcName, SvcState, SvcDisplayName, TimeGenerated
I’m projecting only the information I need, the computer that triggered the alert, the service name, service state, service display name and the time generated. Adding a Project sends only the data you want to your Action Group.
Common Alert Schema
If you have created an Action Group recently then you’ve probably seen this button here.
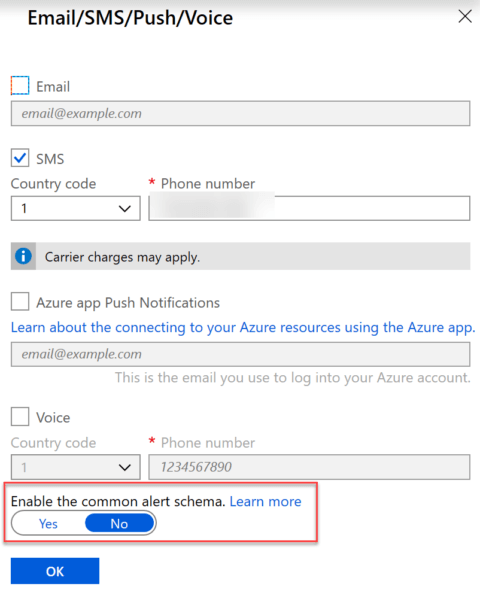
The Common Alert Schema was created to standardize alerts between Metric, Log and Activity log alerts, each of which had their own templates and schemas. If you’re not familiar with them you can read more about it here.
I have no inside information but I suspect that at some point whatever the “no” option is called on the Action Group will go away and we’ll have just the Common Alert Schema.
Action Groups
Just a few notes on Action Groups, you can have up to 5 different action groups per alert. There are a few different types of Action Groups:
- Logic App
- Azure Function
- Azure Automation
- Email/SMS/Push/Voice
- Secured Webhook
- Webhook
- ITSM Connector
- Email Azure Resource Manager Role
4 thoughts on “Azure Monitor Alerting”
Comments are closed.