In my previous post I showed how you can setup a website availability monitor within Application Insights. That post gave us some data to use and play with. In this post, I’m going to show you how you can light up your world with Application Performance Monitoring (APM) in Application Insights. Unlike the Website Availability monitor we created previously, APM in available in the cloud and on prem apps. As long as your application can send data over HTTPs to your AppInsights workspace.
What is Monitored
from MS documentation https://docs.microsoft.com/en-us/azure/azure-monitor/app/app-insights-overview
- Request rates, response times, and failure rates – Find out which pages are most popular, at what times of day, and where your users are. See which pages perform best. If your response times and failure rates go high when there are more requests, then perhaps you have a resourcing problem.
- Dependency rates, response times, and failure rates – Find out whether external services are slowing you down.
- Exceptions – Analyze the aggregated statistics, or pick specific instances and drill into the stack trace and related requests. Both server and browser exceptions are reported.
- Page views and load performance – reported by your users’ browsers.
- AJAX calls from web pages – rates, response times, and failure rates.
- User and session counts.
- Performance counters from your Windows or Linux server machines, such as CPU, memory, and network usage.
- Host diagnostics from Docker or Azure.
- Diagnostic trace logs from your app – so that you can correlate trace events with requests.
- Custom events and metrics that you write yourself in the client or server code, to track business events such as items sold or games won.
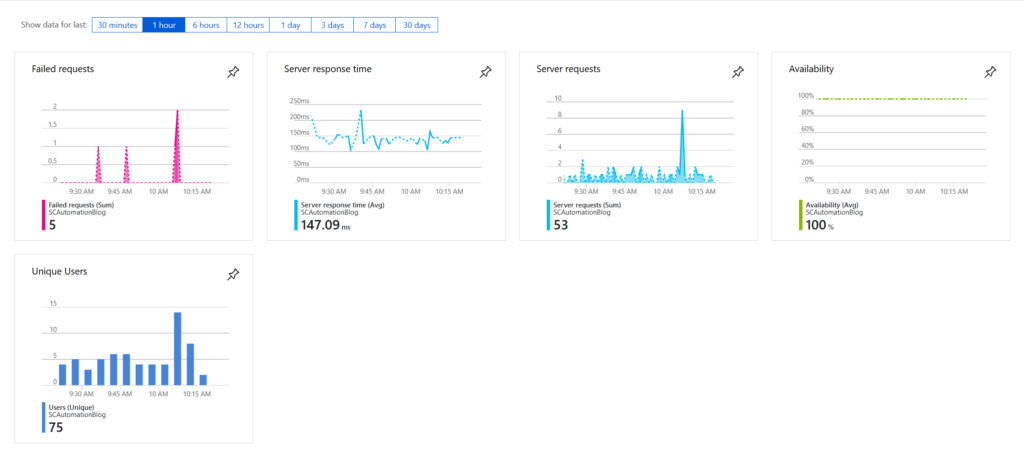
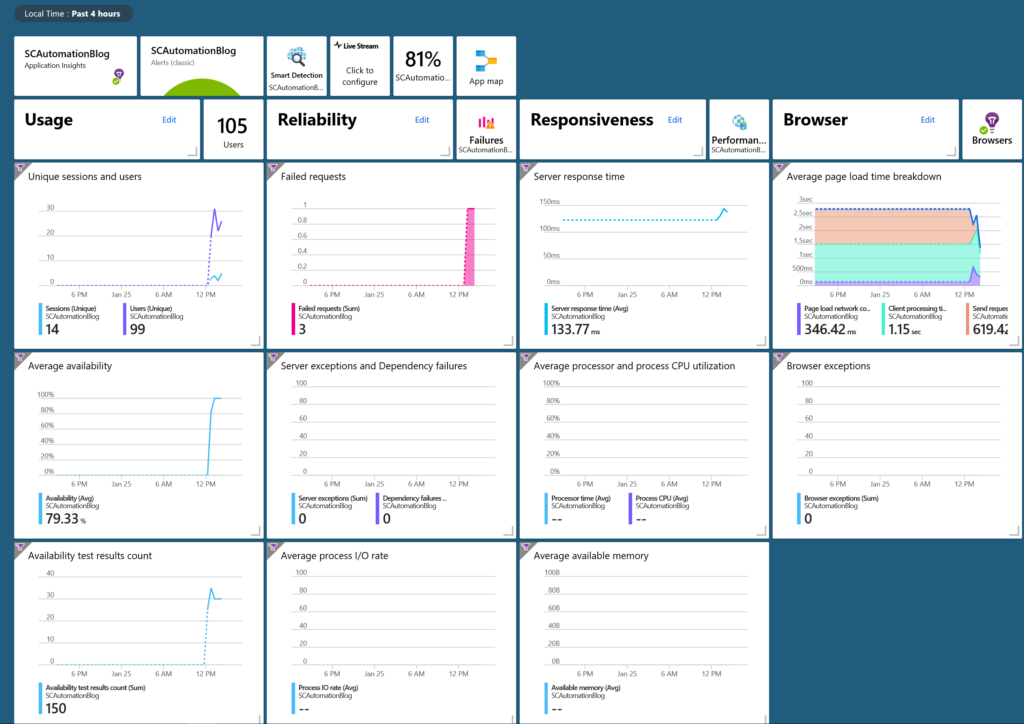
Recall one of the screen shots from my web availability monitor, showed this same screen shot, but only availability was lit up. Now all of them are and more.
Prerequisites
You’ll need:
- a Application Insights workspace
- your Application Insights instrumentation key
- to know what kind of app you’re using
As of this writing Application Insights performance monitoring can be used with:
- .NET
- .NET Core
- Java
- Mobile apps
- Web apps
for more information on how to set it up for your application you can look here.
For my purposes I’m using the WordPress AppInsights plugin. It’s open source and hosted on Github.
Setup on WordPress
This is so easy to setup, I mentioned it to Adam Gross and he set it up from his phone while we drove from Houston to Austin to present at CTSMug. #CTSMug on twitter.
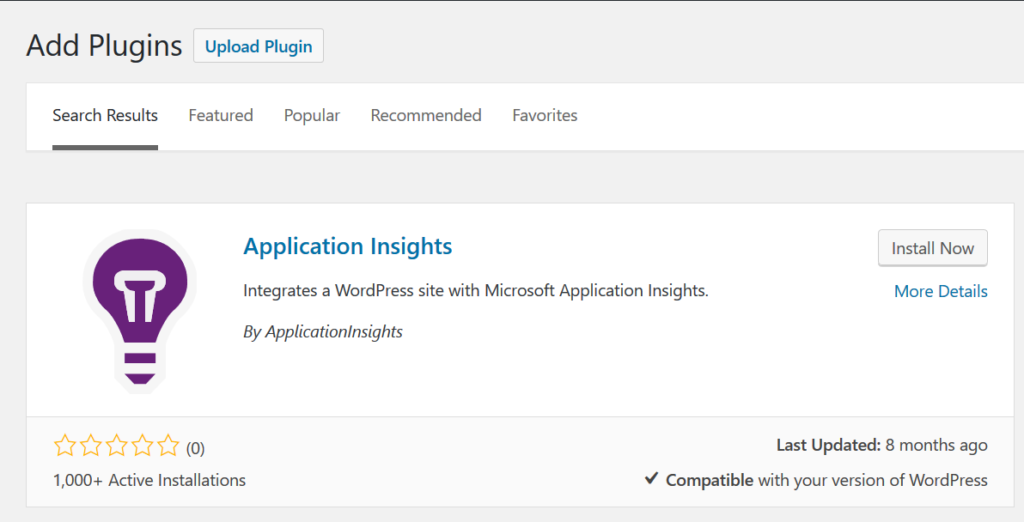
Simply search the wordpress plugins to find it, then install it.
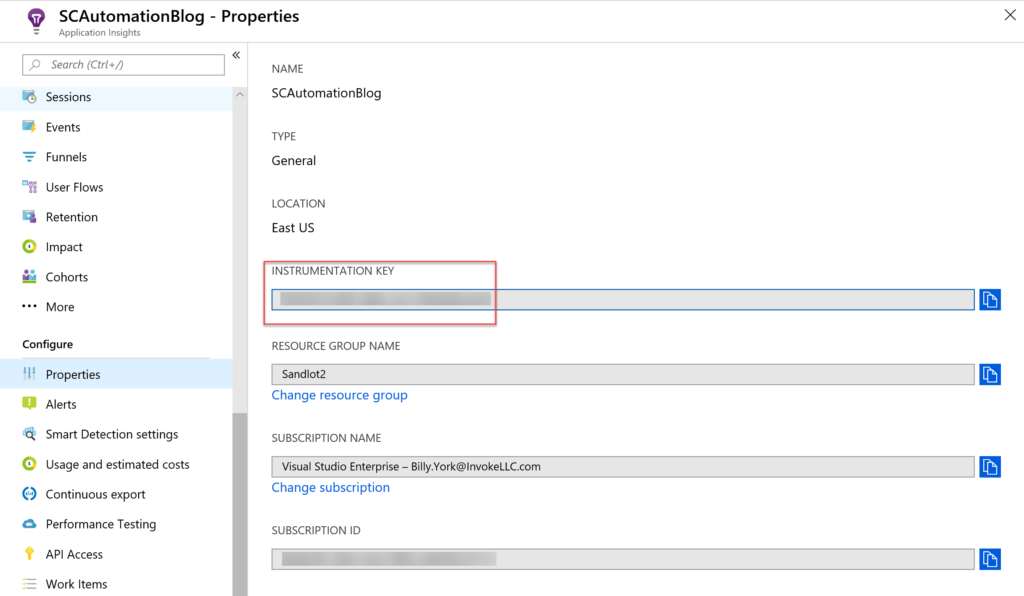
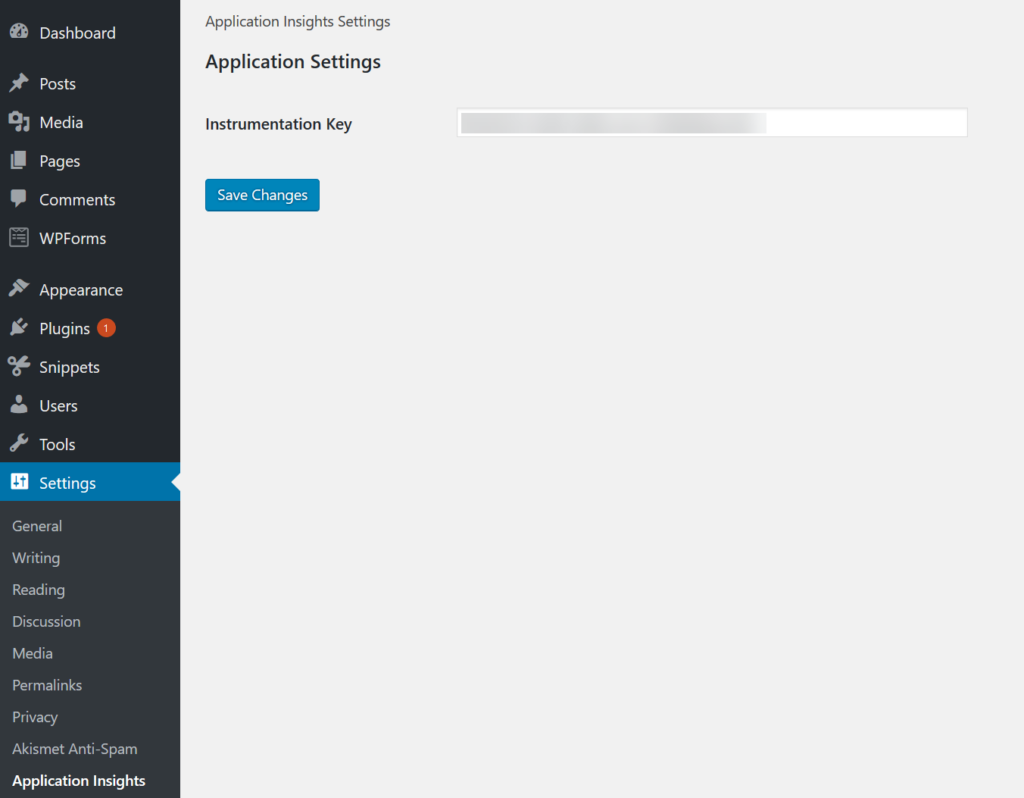
Grab your instrumentation key from AppInsights, its under Properties.
Then add it to the plugin its found under settings -> Application Insights.
Within minutes I had data lighting up dashboards in AppInsights. And yes, you dear reader, reading this post at this very moment is generating data in my AppInsights. So thank you for that!
Dashboards
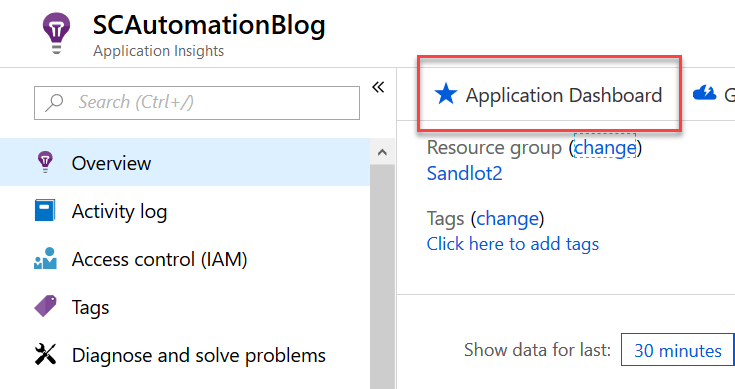
How to get to this dashboard. Under the overview tab of your App, its the application dashboard.
So, I have to say as someone that’s been using Log Analytics over the last year plus, I’m jealous of this dashboard for a few reasons, first of all its built for you, automatically. Second of all, each tile opens up its respective space within the AppInsights workspace. For those of you familiar with pinning queries to dashboards from Log Analytics, you don’t really have that option. Or any option of linking to a broader dashboard or a view designer based dashboard. Clicking the analytics button opens the query in Log Analytics. The icons at the top are especially cool, there is nothing like that available in Log Analytics. In Log Analytics many of the solution dashboards are developed within View Designer, which at the time of this writing is, imo, limited.
I’m not going to go through every possible feature available in APM, that would take a number of posts or even a whole book. That said I’m going to go over where I found value or what I thought was cool. The first of which were failures.
Failures
Yes, failures can be cool. They instantly tell you something is wrong with some portion of your site. The last thing anyone wants is people finding a bunch of 404 errors on their website.
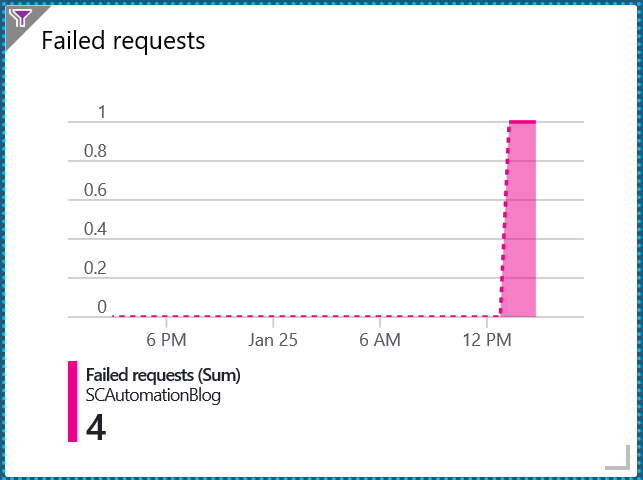
As mentioned clicking the tiles opens up their respective blade within AppInsights.
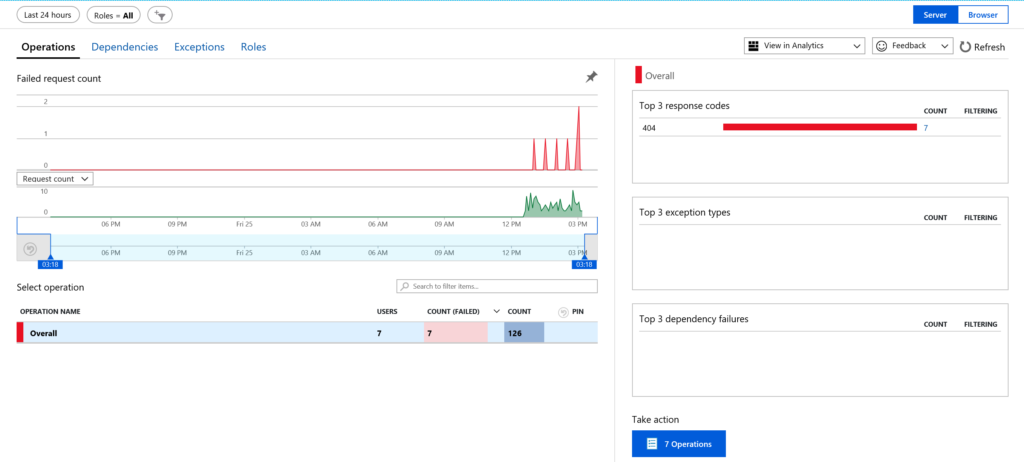
Clicking the tiny little count number (seven in the image above) or the Take Action button at the bottom, opens up a new blade, where you can click on all errors. I found this very useful as I found my Document SCOM Distributed Apps post had a bad redirect. I was able to easily add a redirect rule and fix that issue. It hasn’t seen it pop up since. There were a few other redirect issues identified that I have since rectified.
To do more investigation on failures they are under the “requests” table in AppInsights.
requests
| where client_Type != "Browser"
| where success == false
Smart Detection
Continuing with failures for a minute, Smart Detection is supposed to use machine learning to tell you about failure anomalies from memory leaks to performance issues, trace degradation and more. That said, so far its only shown me HTTPs issues, that I can’t quite figure out what its telling me.
Under Configure there is Smart Detection settings.
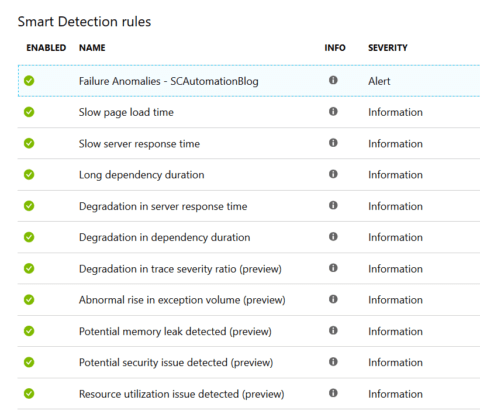
You can enable/disable each of these settings by clicking on them.
Going back up to Investigate.
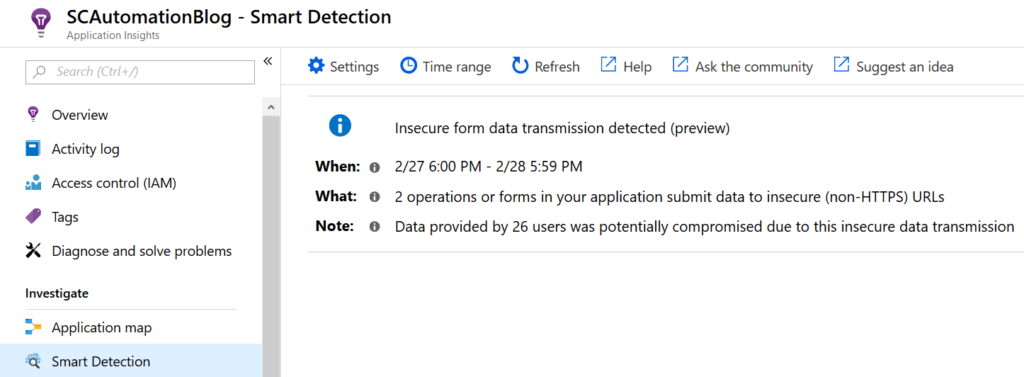
This information is clickable, where it tells me a specific post is having issues. That said no form data is on any of my blog posts, the only form I have is on the Hire Me page.
Using this query the best I can tell is that its either the key word tags which are searchable on my site, turn up HTTP instead of HTTPS, or screen grabs that aren’t HTTPS.
requests
| where isnotempty(user_Id) and isnotempty(name) and isnotempty(url)
| where name startswith 'POST'
| where url !startswith 'https'
I can imagine on much larger apps or at scale this could come up with some pretty cool results.
Usage: Users and User Flows
Under Usage, there are a number of things you can examine or setup like Funnels, where you can track usage flow from one page to another.
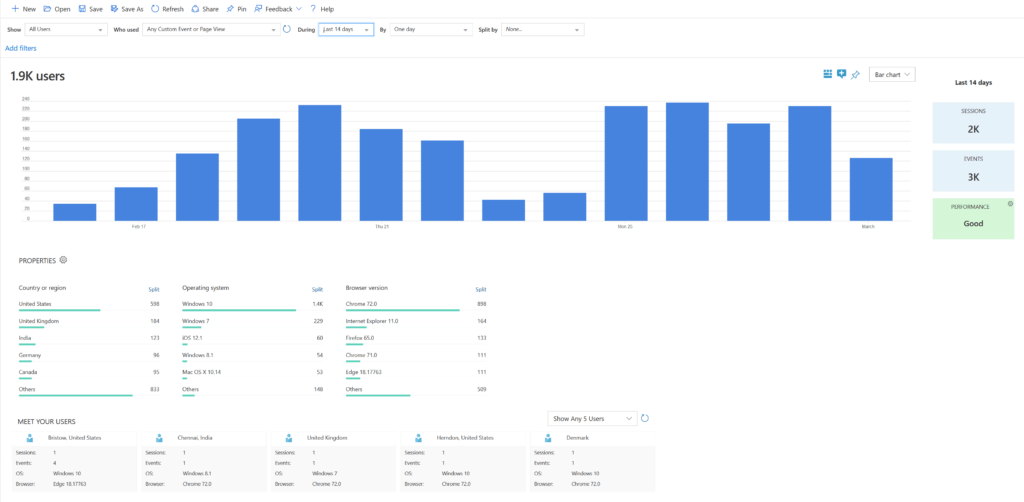
Under users you can track user count for any or all pages and get the browser, and operating system used to access your site.
I also found User Flows to be really cool. You have to setup how you want it, for me it auto picked a random post and generated a graph.
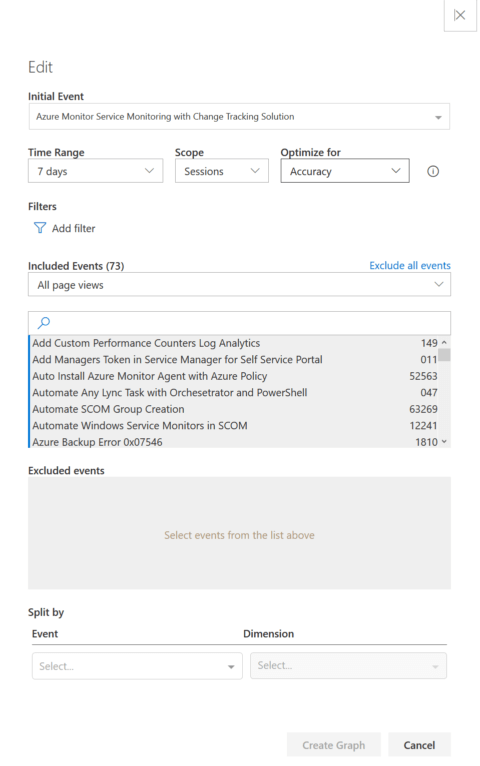
Clicking edit to setup the flow generates this cool diagram, which shows the first 4 steps before access the page you selected and shows you the 4 steps after users accessed that page. You can expand each step up to 9.
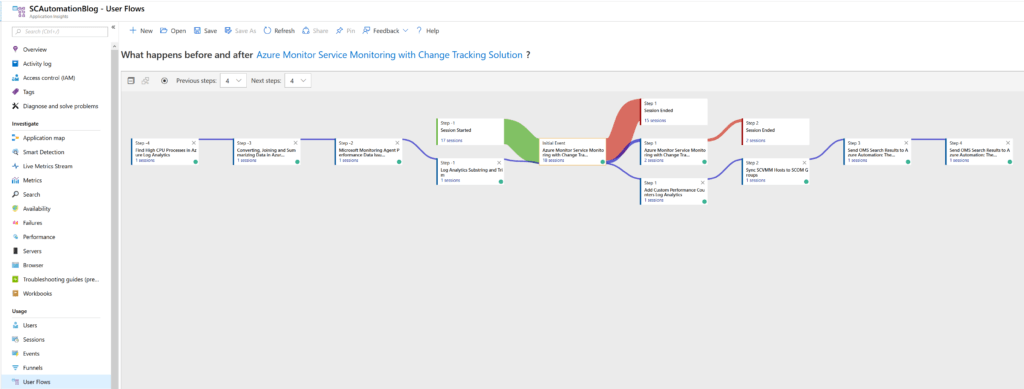
Using User Flows you can really get a sense for what pages are driving traffic to other pages.
Others
Obviously I’ve only showed a select few features of AppInsights, one of the cool features is Application Map. Much like Service Map and Network Performance Monitor in Azure Monitor, it automatically builds a live diagram of your application. For me since my website is hosted elsewhere and I have no access to the DB or servers, it couldn’t build it out other than just a plain circle for what it does have access to. Metrics and Performance are pretty standard, especially Metrics which is the same across all azure resources.
Billing
Finally, a quick note on billing, everyone’s favorite topic. What does it cost? As you can see below over the last 31 days it cost me 7 cents in data ingestion. Thats with about 5k unique page views over that time.
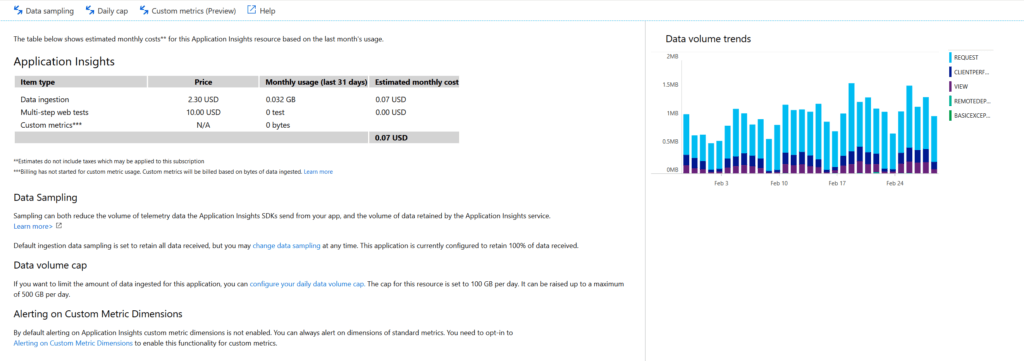
As always consult your licensing people for your own estimate on what it may cost you.
Summary
Adding Application Insights to monitor your apps along with the rest of Azure Monitor offers a truly holistic monitoring solution from server and networking infrastructure, to PaaS services to your custom applications and more.
2 thoughts on “Application Performance Monitoring with Application Insights”
Comments are closed.