This post is aimed at beginners with Azure Log Analytics. I’ll be discussing how you can use the Azure Log Analytics Summarize operator when you query data in your Log Analytics workspace. The Summarize Operator will likely be the most commonly used Operator. It seems like at least once a week I learn something knew that it can do. I’ve already used the summarize operator in posts here and here. Those posts I used in the summarize operator in real world examples. This post, however will be all about different ways you can use Summarize.
Summarize with Aggregation
The Summarize operator isn’t very useful on its own. It essentially works like the distinct operator. For example these two queries return the same results.
Perf
| summarize by ObjectName, CounterName

Perf
| distinct ObjectName, CounterName
both return the exact same 41 records under Perf for my environment.
For summarize to really be useful, we need to use an aggregation with it. Some of my favorites are avg(), dcount(), min(), max(), sum(). You can find all the currently available aggregation functions here
To summarize the average CPU usage use the avg() aggregator
Perf
| where ObjectName == "Processor"
              and CounterName == "% Processor Time"
              and InstanceName == "_Total"
| summarize avg(CounterValue) by Computer
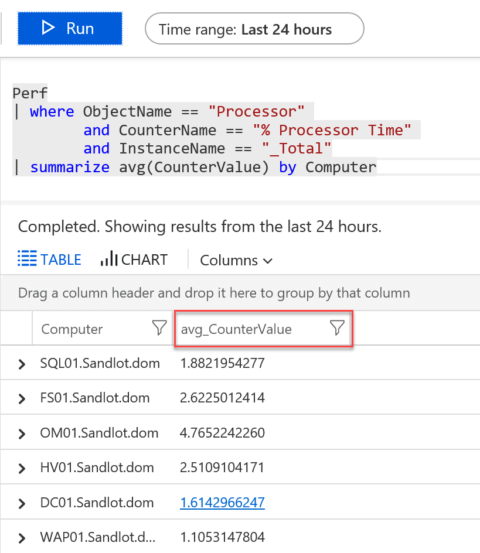
Notice that in the results pane instead of the CounterValue field there is a new field avg_CounterValue. Whenever you use the Summarize Operator the result will produce a new field name with the aggregator in front. For instance dcount() would be dcount_CounterValue.
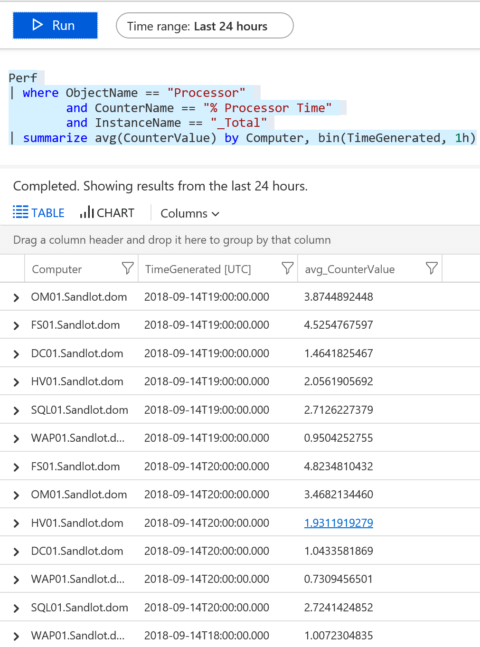
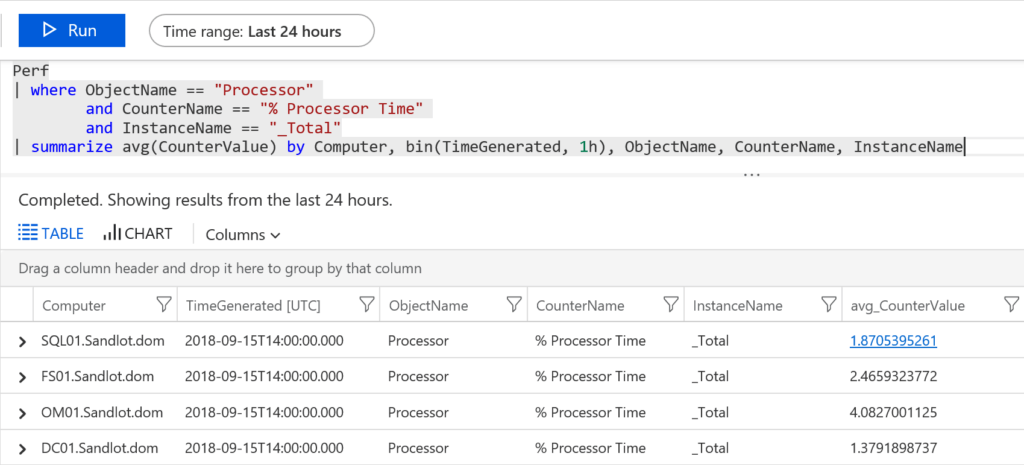
Summarize with TimeGenerated & bin
One of the first things to understand when using the Summarize operator is that Log Analytics can A) create a bin of your data by TimeGenerated and B) that if you don’t specify a bin time, it does it for you using hourly binning.
Using the same example as above, simply add a TimeGenerated field to it, and it produces and hourly bin for the Time range that is specified next to run, in this instance its 24 hours. So the results should include roughly 24 hourly bins for each computer in the environment.
Perf
| where ObjectName == "Processor"
        and CounterName == "% Processor Time"
        and InstanceName == "_Total"
| summarize avg(CounterValue) by Computer, TimeGenerated
will produce the same result as if we added bin(TimeGenerated, 1h)
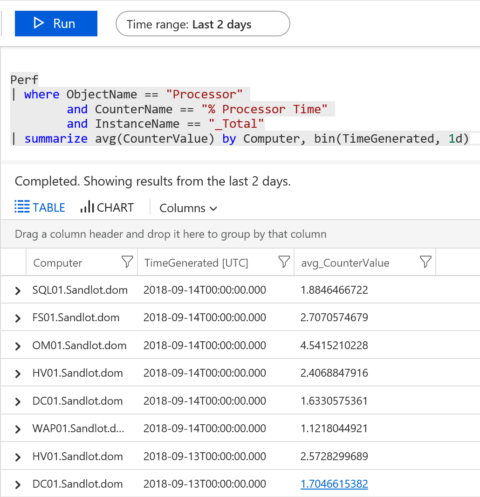
That said, when summarizing data from days, weeks or months, an hourly bin is probably too aggressive and expensive. An hourly bin in those instances will take a long time to produce your results.
For instance expanding the time range to 2 days but adding bin(TimeGenerated, 1d) produces 18 records, instead of 149 that the 24 hour, hourly binned query produced.
You can bin by whatever time metric you want, 12h (twelve hours), 5m (five minutes). It all depends on how often you have data coming in. For instance binning by 5m on data that comes in every 15 minutes is not going to produce very good results. However, if you binned by 15 minutes on data that came in every 5, that would give you much better results.
Summarize works like Project
Aside from Summarizing data, the operator works almost exactly like the Project operator, which I talked about here. In the previous CPU Summarize examples you may have noticed there are only 2 or 3 fields returned. Computer, the avg_CounterValue field and the TimeGenerated field was included in the bin example.
Using the same example as before, I add the ObjectName, CounterName and InstanceName fields.
 Perf
| where ObjectName == "Processor"
              and CounterName == "% Processor Time"
              and InstanceName == "_Total"
| summarize avg(CounterValue) by Computer, TimeGenerated, ObjectName
                     , CounterName, InstanceName
Just like Project, anything that’s not included after the operator is eliminated.
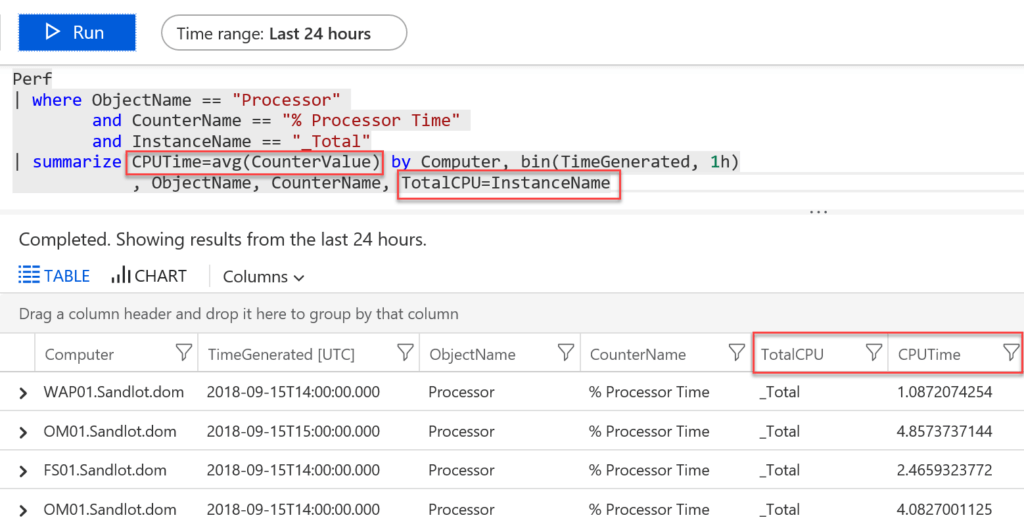
And just like the Project operator, you can rename fields as well. In this query avg_CounterValue and InstanceName have been renamed to CPUTime and TotalCPU respectively.
Perf
| where ObjectName == "Processor"
              and CounterName == "% Processor Time"
              and InstanceName == "_Total"
| summarize CPUTime=avg(CounterValue) by Computer, bin(TimeGenerated, 1h)
                       , ObjectName, CounterName, TotalCPU=InstanceName
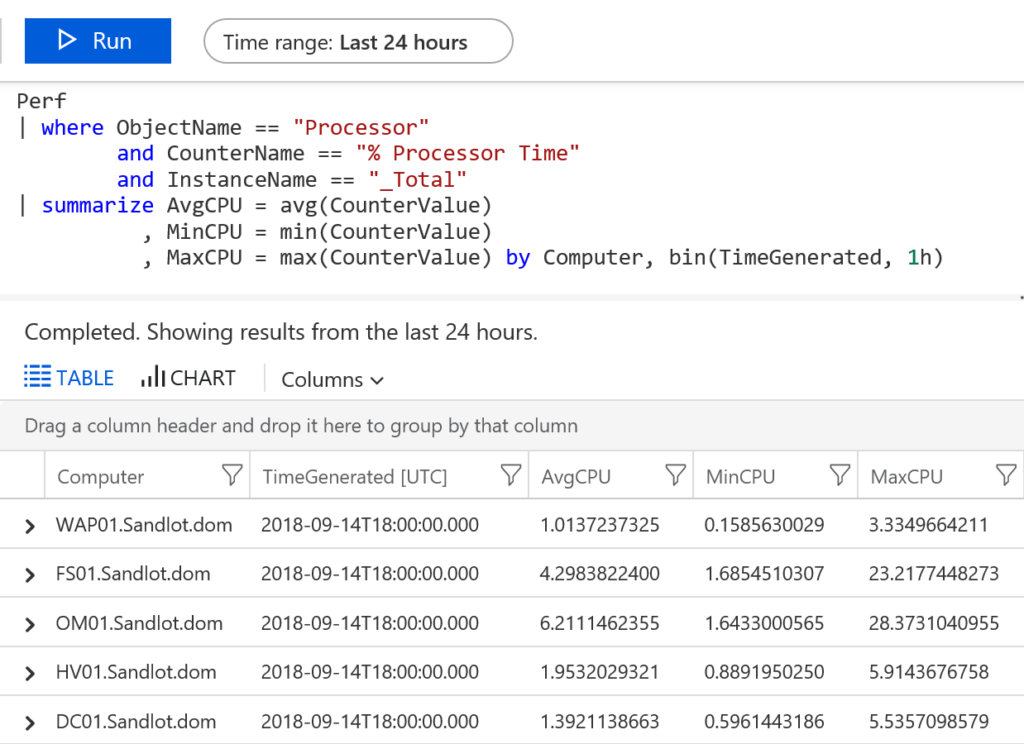
Summarize with Multiple Aggregators & Values
So far I have shown how you can summarize an average of the counter value, but what if we want to get multiple at the same time? Like min() and max(). With the summarize operator we can summarize multiple aggregators at the same time. Following the CPU example, I have added min and max. I also renamed all three to AvgCPU, MinCPU, MaxCPU. Each will be summarized for the last 24 hours and binned by 1 hour time frames.
Perf
| where ObjectName == "Processor"
              and CounterName == "% Processor Time"
              and InstanceName == "_Total"
| summarize AvgCPU = avg(CounterValue)
                     , MinCPU = min(CounterValue)
                     , MaxCPU = max(CounterValue) by Computer, bin(TimeGenerated, 1h)
We can also summarize multiple objects at the same time, like Memory and CPU. By using ‘or’ we can put our where conditions inside parenthesis and search for multiple objects and their counter values at one time.
Perf
| where (ObjectName == "Processor"
              and CounterName == "% Processor Time"
              and InstanceName == "_Total")
        or (ObjectName == "Memory"
              and CounterName == "% Committed Bytes In Use")
| summarize avg(CounterValue) by Computer, bin(TimeGenerated, 1h)
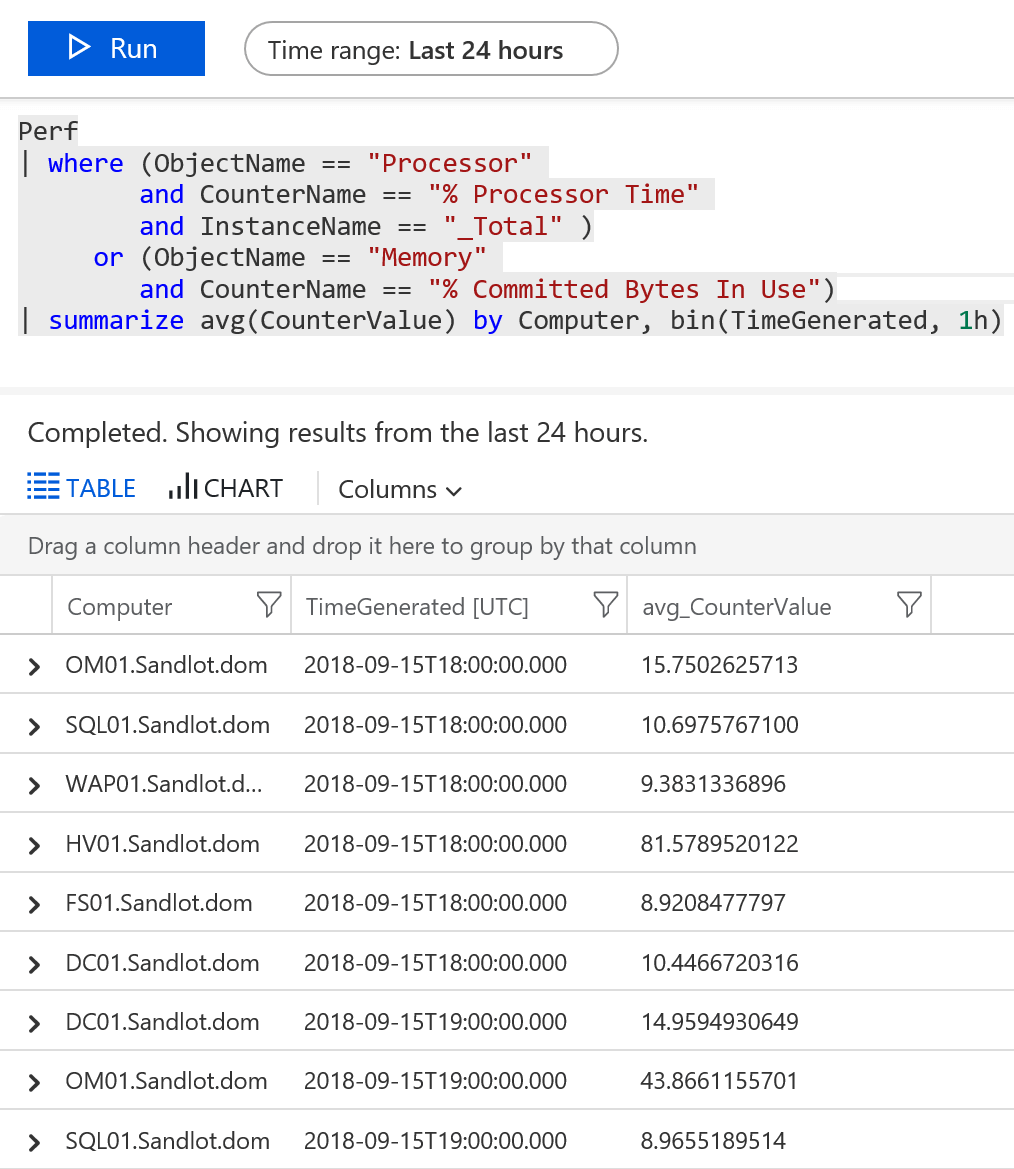
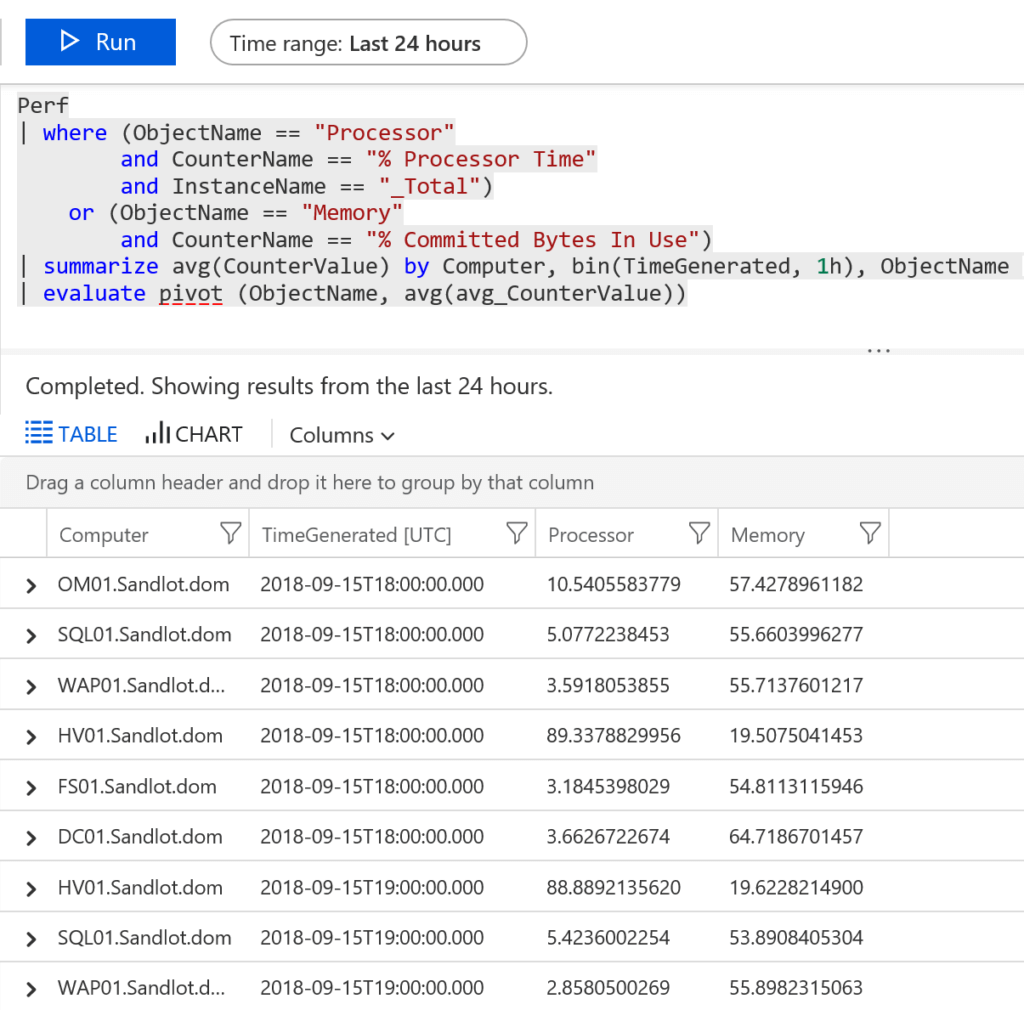
But, which value belongs to which Object?
We can add the ObjectName after our summarize, but even better would be putting the ObjectName up top with the counter value below it. To do this we can use the evaluate operator with pivot.
Perf
| where (ObjectName == "Processor"
               and CounterName == "% Processor Time"
               and InstanceName == "_Total")
         or (ObjectName == "Memory"
               and CounterName == "% Committed Bytes In Use")
| summarize avg(CounterValue) by Computer, bin(TimeGenerated, 1h), ObjectName
| evaluate pivot (ObjectName, avg(avg_CounterValue))
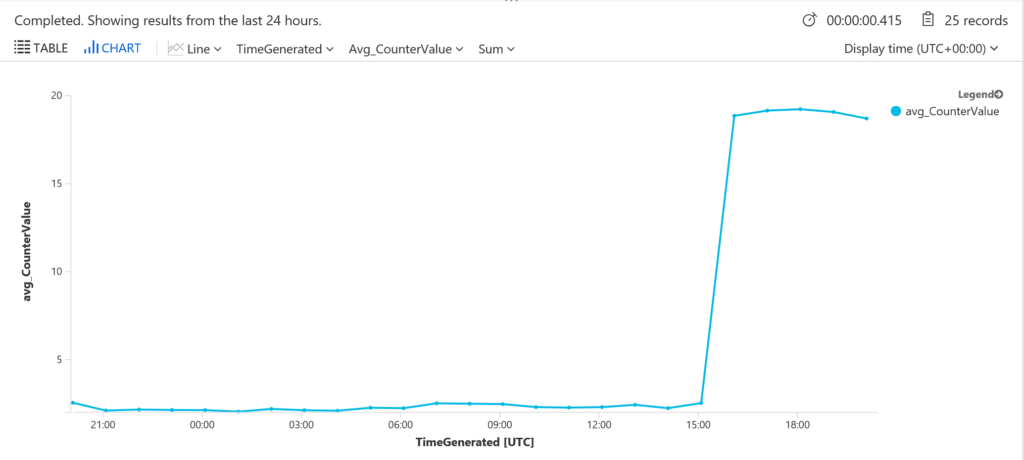
Visualizing data with Summarize
One of the most useful things to do with Summarize is to create graph data with it. Using bin(TimeGenerated, ) from above allows us to graphically represent any data we want over a period of time.
For example, creating a graphical aggregation of all my servers by CPU usage I could use the following query.
Perf
| where (ObjectName == "Processor"
               and CounterName == "% Processor Time"
              and InstanceName == "_Total")
| summarize avg(CounterValue) by bin(TimeGenerated, 1h)
| render timechart
however simply adding Computer to the query we get them graphed separately.
Perf
| where (ObjectName == "Processor"
and CounterName == "% Processor Time"
and InstanceName == "_Total")
| summarize avg(CounterValue) by Computer, bin(TimeGenerated, 1h)
| render timechart
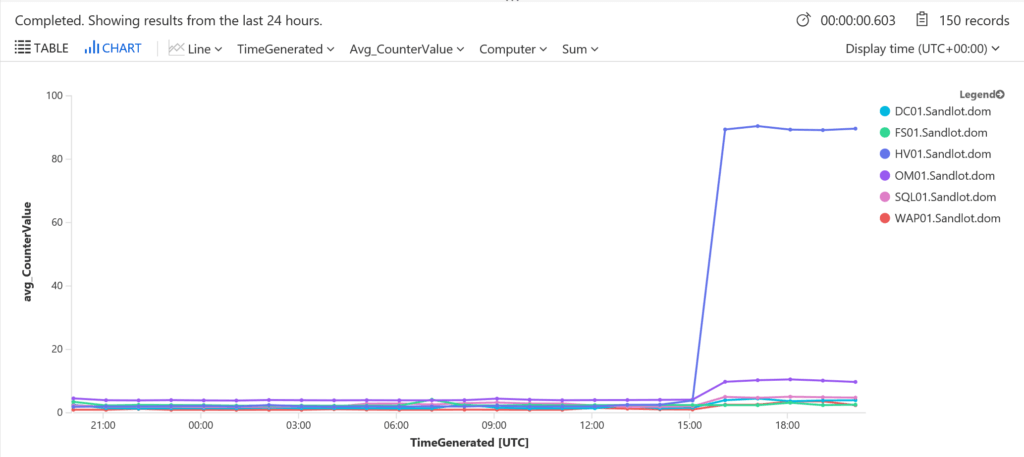
I’m not going to go super in depth into graphing as that’s really a post unto itself, just know that its there and really useful when creating views in the view designer.
Log Analytics Summarize Operator
The Log Analytics Summarize Operator is quite powerful and very useful in a lot of scenarios. If you made it this far, hopefully this post helped better understand the operator.
2 thoughts on “Azure Log Analytics Summarize Operator”
Comments are closed.