Any good monitoring solution has performance counters. Monitoring performance of your systems can put you ahead of issues, allowing you to be proactive, instead of reactive. That said, Azure Log Analytics Performance Counters aren’t enabled by default. However, it’s very easy to enable them and they add a ton of value to the monitoring environment.
Adding Default Counters
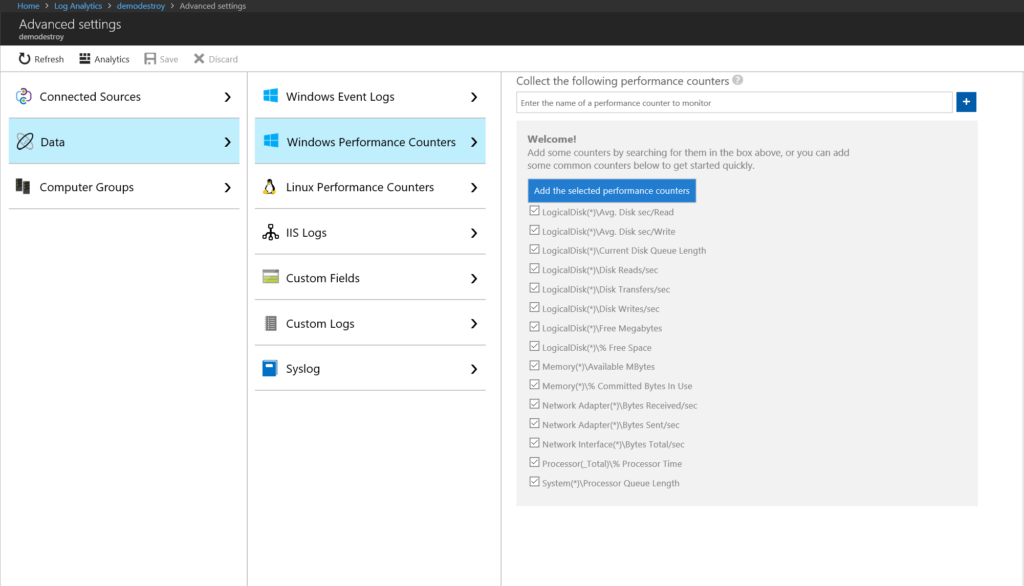
First, in your Azure Portal Log Analytics workspace, go to advanced settings, Data, Windows Performance Counters. Note you can do the same for Linux, but this example covers Windows.
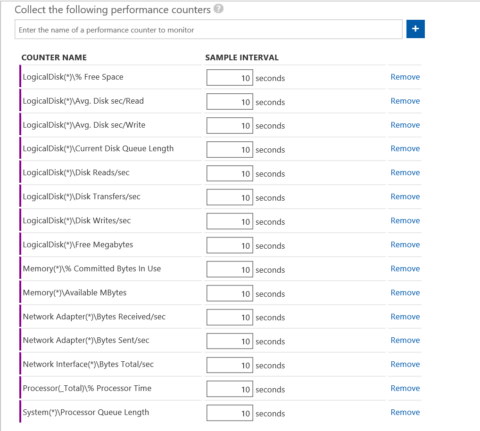
Click add to add the default suggested counters. You’ll see them added with purple lines, meaning they haven’t been saved to your workspace yet. Also note, depending on your subscription type, the sample rate can be as high as 10 seconds. You can certainly tune these to different intervals, just be aware that these are global settings.
Adding Additional Counters
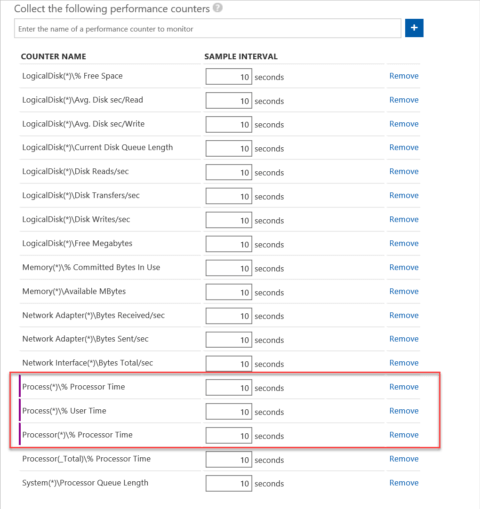
But that is not all. There are literally thousands of other counters you can add. See in the screen grab below how little the right scroll bar is and I just typed “process” in.
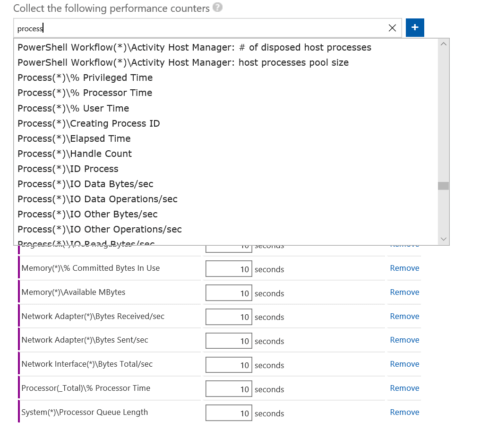
In this example I want:
Process(*)% Processor Time
Process(*)% User Time
Processor(*) % Processor Time
Because I will be using these in some later posts.
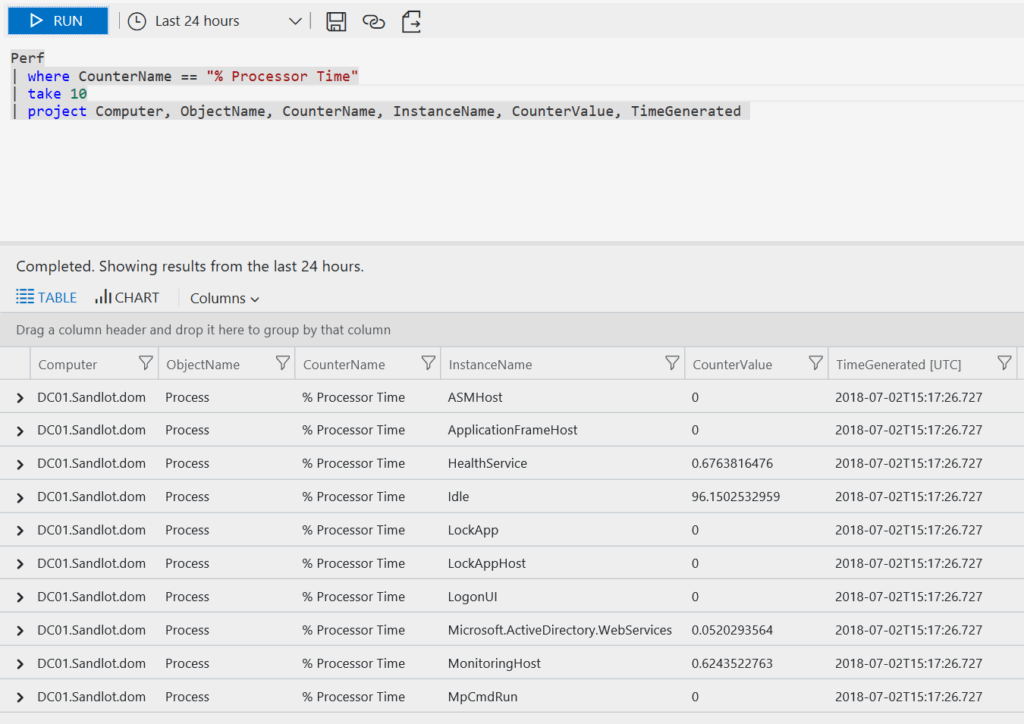
After waiting a few minutes, data starts to flow in. This simple query shows a sample of some of the data. In particular if you look at the InstanceName, we can actually see what processes are using what percentage of the CPU.
and that’s how we add Azure Log Analytics Performance Counters to our workspace.
2 thoughts on “Getting Started with Azure Log Analytics Performance Counters”
Comments are closed.